Sarasota Crash
Statistics Breakdown
Understanding Sarasota’s
Accident History and Trends
Sarasota’s roads tell a story of beauty and risk, with thousands of crashes shaping the safety landscape over the years. Dive into the historical data and trends below to see how accidents have impacted our community—and what it means for your safety and rights. If you’ve been in a crash, we’re here to hep.
Key Statistics Snapshot

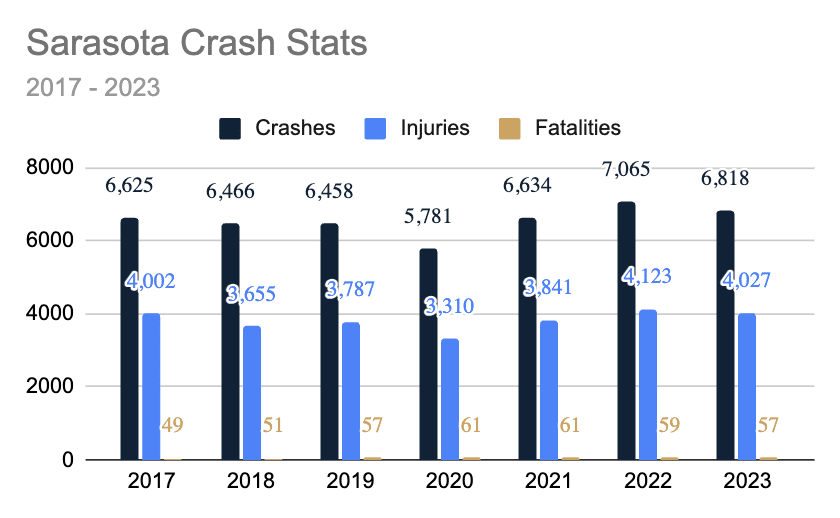
Average Annual Crashes (2017-2023): ~6,550
Total Fatalities (2017-2023): 395
Total Injuries (2017-2023): 26,745
Crash Rate: Roughly 1 crash per 70 residents annually (adjusted for tourism).
Breakdown by Accident Type
Sarasota’s mix of urban streets, coastal roads, and tourist traffic creates a unique crash profile. Here’s how accidents have historically broken down, based on data up to 2023:
Car Accidents
- ~70% of total crashes (e.g., 5,107 in 2022)
- Often tied to high-traffic roads like U.S. 41.
Pedestrian Accidents
- ~15% (e.g., 1,094 in 2022)
- Concentrated in downtown and near beaches.
Boating Accidents
- ~5% (e.g., 365 in 2022, coastal estimate)
- Spikes during summer boating season.
Motorcycle/Bicycle
- ~10% (e.g., 730 in 2022)
- Higher fatality rates per incident than car crashes.
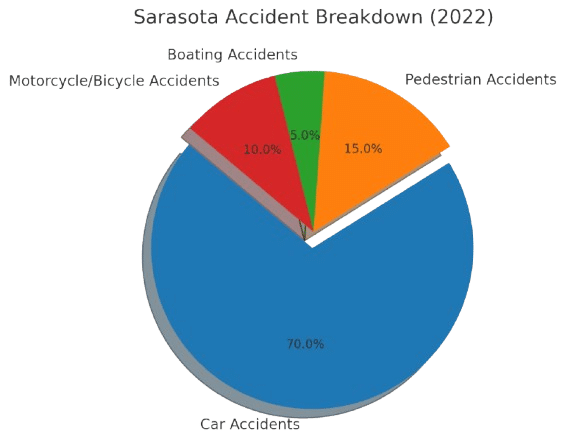
Picture a pie chart showing these percentages based on 2022 data as a representative sample.Source Links:
Historical Trends Over Time
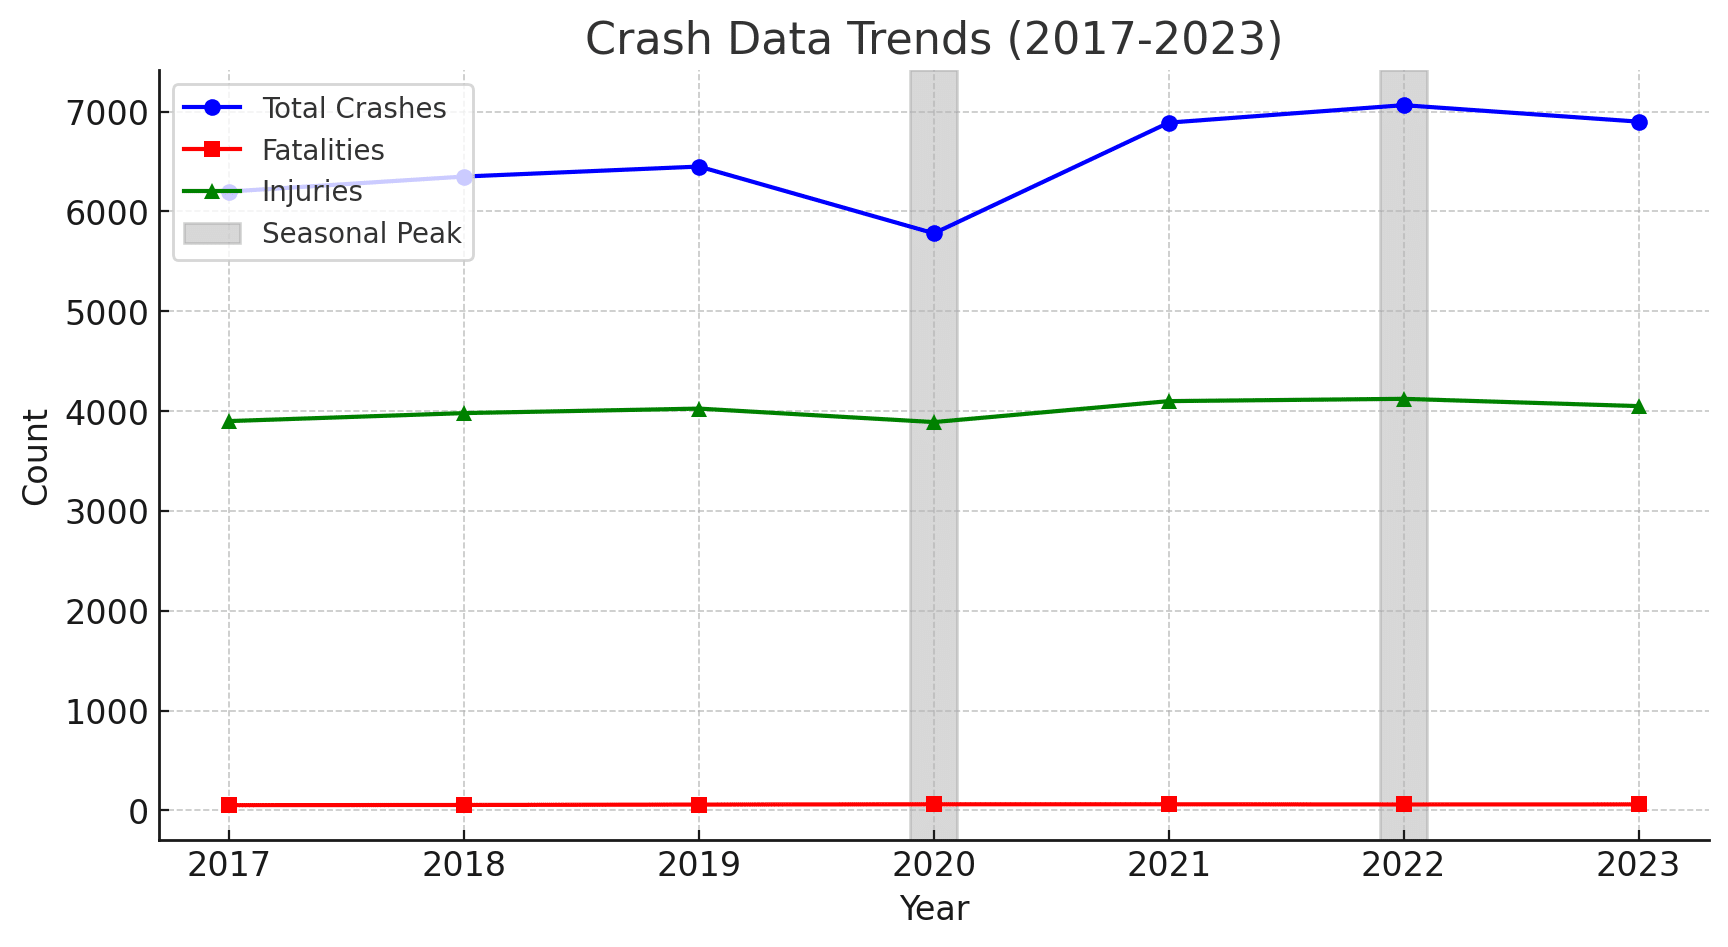
Source Links:
Total Crashes
Fatalities
Injuries
Seasonal Spikes
Dangerous Intersections in Sarasota
Dangerous Intersections in Sarasota
Some intersections stand out as perennial trouble spots based on historical crash data:
U.S. 41 & Bee Ridge Road: High traffic and commercial activity lead to frequent rear-end and side-impact crashes.
U.S. 41 & Siesta Drive: Narrow lanes and tourist confusion contribute to collisions.
University Parkway & I-75: Congestion from growth has made this a crash hotspot.
U.S. 301 & 17th Street: Pedestrian risks and heavy flow downtown increase incidents.
Jacaranda Blvd & East Venice Ave: Confusing roundabout design causes regular accidents.
Local Insights and Context
What drives Sarasota’s crash trends?
- Tourism: Snowbirds and visitors from November to February swell traffic volumes.
- Weather: Rainy summers create slick roads, boosting crash rates.
- Population Growth: Sarasota’s population rose 4x the national average in recent years, adding pressure to roads.
- Road Design: U.S. 41’s tight lanes and roundabouts (e.g., Gulfstream Ave, 120 crashes in 2023) challenge drivers.
What This Means for You
Sarasota’s crash history offers lessons:
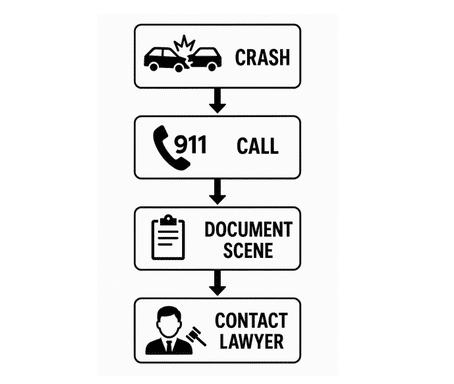
Stay Vigilant
Know the Law
Act Quickly
Injured in a Crash? We’ve Got Your Back
Sarasota’s crash stats highlight the risks we all face. If you’ve been hurt, get a free consultation today.
